The Chinese proverb “Tell me and I’ll forget; show me and I may remember; involve me and I’ll understand” mentioned above proves the strong effectiveness of visual tools in the classroom. Among these tools are presentations, flashcards, realia, and of course, infographics. What does the latter mean and how can it be helpful in our classrooms with kids?
What is Infographic?
The name prompts that it is connected with information and graphic. Actually, it represents information designed in a graphic format and makes it easily comprehensible. Infographics include visual elements, such as mind maps, line charts, tree diagrams, images, etc.
Benefits of Using Infographics
Did you know that most people are visual creatures? In fact, about 65 percent of the learners are visuals. According to the statistics, visuals can recall 65 percent of what they saw and only 10 percent of what they heard. Consequently, it is no surprise that more and more teachers are doing their best to bring infographics into their classrooms. Here are the most important advantages of using infographic during your lessons.
— It helps students to get motivated to learn.
— Saves your time and energy.
— Brings interest and brightness into the classroom.
— Provides clarification of the content.
— Uncovers the information at different levels in details but short.
— It gets kids to think critically.
How to Create Infographics?
You can find plenty of interesting websites with multiple designs and tools to create infographics. Among the famous infographic maker websites are Piktochart.com, Visme.co, Easel.ly, Visualize.me, Infogram.com, etc. However, creating infographics is not only about good websites, but also about correct and logical writing. Here are some steps to follow carefully while creating infographics.
— Write a short and expressive headline. Use numbers, adjectives and key words to draw readers’ interest, e.g. “5 fun activities to practise Modal verbs”.
— Structure your infographic. It must have a good introduction, section subheadings covering different topics and key images. If necessary, you can also insert chart and graph labels.
— Don’t overload the text. Remember that infographic is a visual aid and you can’t use more words than images. There should always be balance not to bore your kids.
— Proofread the text. This is even more important than just writing. Try to delete unnecessary words from the text and leave only the most important ones.
When to Use Infographics?
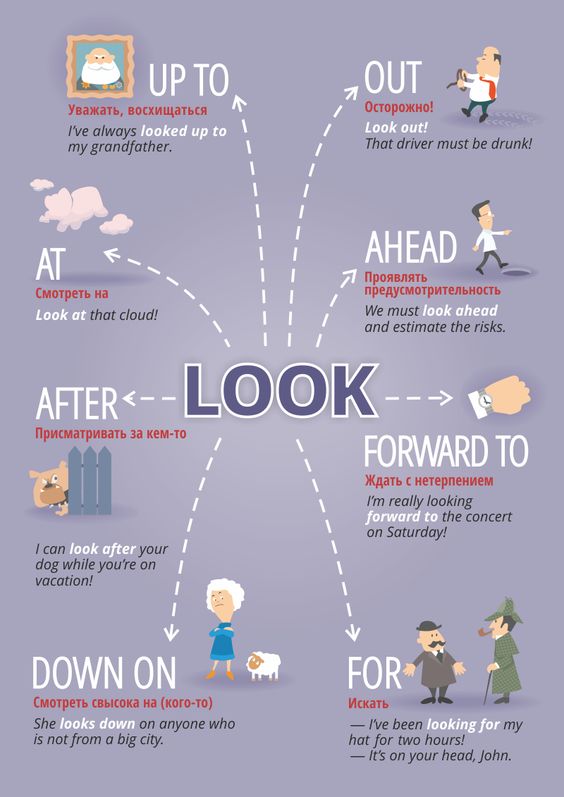
— Introduce vocabulary with infographics. Use keywords and images in your infographics. It works really perfectly especially with phrasal verbs, idioms, and thematic vocabulary. You can download this kind of infographics from Pinterest.


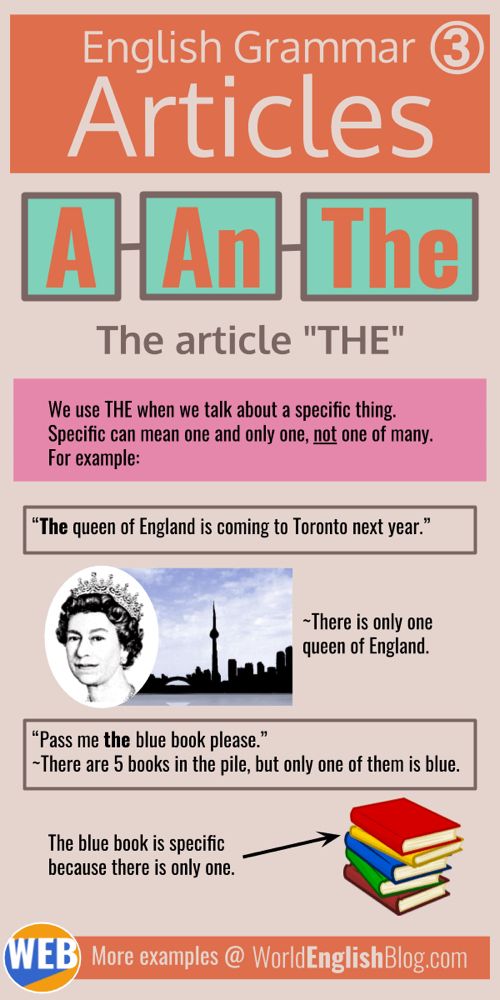
— Make Grammar easier with Infographics. Instead of long explanations on grammar materials, create a proper infographic with key points and examples. This will definitely help your kids to understand and recall the rules.

— Start a discussion with infographics. Choose a topic of discussion, e.g. Friendship, Kindness, Help, Family, etc. Write down corresponding questions and start a discussion with your kids.
To sum up, we can say that an infographic turns out to be extremely useful when working with kids since it combines written and visual elements of learning. Infographics keep them engaged in the classroom and brings motivation. So, don’t hesitate to spice up your classes with this marvellous tool.


 Маргарита Аветисян


